

Every computer system benefits from proper administration and monitoring. Keeping an eye on how your system is running will help you discover issues and resolve them quickly.
There are plenty of command line utilities created for this purpose. This guide will introduce you to some of the most helpful applications to have in your toolbox.
Prerequisites
To follow along with this guide, you will need access to a computer running a Linux-based operating system. This can either be a virtual private server which you’ve connected to with SSH or your local machine. Note that this tutorial was validated using a Linux server running Ubuntu 20.04, but the examples given should work on a computer running any version of any Linux distribution.
If you plan to use a remote server to follow this guide, we encourage you to first complete our Initial Server Setup guide. Doing so will set you up with a secure server environment — including a non-root user with sudo privileges and a firewall configured with UFW — which you can use to build your Linux skills.
Step 1 – How To View Running Processes in Linux
You can see all of the processes running on your server by using the top command:
top
Copy
Outputtop - 15:14:40 up 46 min,  1 user,  load average: 0.00, 0.01, 0.05
Tasks:  56 total,   1 running,  55 sleeping,   0 stopped,   0 zombie
Cpu(s):  0.0%us,  0.0%sy,  0.0%ni,100.0%id,  0.0%wa,  0.0%hi,  0.0%si,  0.0%st
Mem:   1019600k total,   316576k used,   703024k free,     7652k buffers
Swap:        0k total,        0k used,        0k free,   258976k cached

  PID USER      PR  NI  VIRT  RES  SHR S %CPU %MEM    TIME+  COMMAND
    1 root      20   0 24188 2120 1300 S  0.0  0.2   0:00.56 init
    2 root      20   0     0    0    0 S  0.0  0.0   0:00.00 kthreadd
    3 root      20   0     0    0    0 S  0.0  0.0   0:00.07 ksoftirqd/0
    6 root      RT   0     0    0    0 S  0.0  0.0   0:00.00 migration/0
    7 root      RT   0     0    0    0 S  0.0  0.0   0:00.03 watchdog/0
    8 root       0 -20     0    0    0 S  0.0  0.0   0:00.00 cpuset
    9 root       0 -20     0    0    0 S  0.0  0.0   0:00.00 khelper
   10 root      20   0     0    0    0 S  0.0  0.0   0:00.00 kdevtmpfs
The first several lines of output provide system statistics, such as CPU/memory load and the total number of running tasks.
You can see that there is 1 running process, and 55 processes that are considered to be sleeping because they are not actively using CPU cycles.
The remainder of the displayed output shows the running processes and their usage statistics. By default, top automatically sorts these by CPU usage, so you can see the busiest processes first. top will continue running in your shell until you stop it using the standard key combination of Ctrl+C to exit a running process. This sends a kill signal, instructing the process to stop gracefully if it is able to.
An improved version of top, called htop, is available in most package repositories. On Ubuntu 20.04, you can install it with apt:
sudo apt install htop
Copy
After that, the htop command will be available:
htop
Copy
Output  Mem[|||||||||||           49/995MB]     Load average: 0.00 0.03 0.05
  CPU[                          0.0%]     Tasks: 21, 3 thr; 1 running
  Swp[                         0/0MB]     Uptime: 00:58:11

  PID USER      PRI  NI  VIRT   RES   SHR S CPU% MEM%   TIME+  Command
 1259 root       20   0 25660  1880  1368 R  0.0  0.2  0:00.06 htop
    1 root       20   0 24188  2120  1300 S  0.0  0.2  0:00.56 /sbin/init
  311 root       20   0 17224   636   440 S  0.0  0.1  0:00.07 upstart-udev-brid
  314 root       20   0 21592  1280   760 S  0.0  0.1  0:00.06 /sbin/udevd --dae
  389 messagebu  20   0 23808   688   444 S  0.0  0.1  0:00.01 dbus-daemon --sys
  407 syslog     20   0  243M  1404  1080 S  0.0  0.1  0:00.02 rsyslogd -c5
  408 syslog     20   0  243M  1404  1080 S  0.0  0.1  0:00.00 rsyslogd -c5
  409 syslog     20   0  243M  1404  1080 S  0.0  0.1  0:00.00 rsyslogd -c5
  406 syslog     20   0  243M  1404  1080 S  0.0  0.1  0:00.04 rsyslogd -c5
  553 root       20   0 15180   400   204 S  0.0  0.0  0:00.01 upstart-socket-br
htop provides better visualization of multiple CPU threads, better awareness of color support in modern terminals, and more sorting options, among other features. Unlike top, It is not always installed by default, but can be considered a drop-in-replacement. You can exit htop by pressing Ctrl+C as with top.
Here are some keyboard shortcuts that will help you use htop more effectively:
- M: Sort processes by memory usage
- P: Sort processes by processor usage
- ?: Access help
- k: Kill current/tagged process
- F2: Configure htop. You can choose display options here.
- /:: Search processes
There are many other options that you can access through help or setup. These should be your first stops in exploring htop’s functionality. In the next step, you’ll learn how to monitor your network bandwidth.
Step 2 – How To Monitor Your Network Bandwidth
If your network connection seems overutilized and you are unsure which application is the culprit, a program called nethogs is a good choice for finding out.
On Ubuntu, you can install nethogs with the following command:
sudo apt install nethogs
Copy
After that, the nethogs command will be available:
nethogs
Copy
OutputNetHogs version 0.8.0

  PID USER     PROGRAM                      DEV        SENT      RECEIVED
3379  root     /usr/sbin/sshd               eth0       0.485       0.182 KB/sec
820   root     sshd: root@pts/0             eth0       0.427       0.052 KB/sec
?     root     unknown TCP                             0.000       0.000 KB/sec

  TOTAL                                                0.912       0.233 KB/sec
nethogs associates each application with its network traffic.
There are only a few commands that you can use to control nethogs:
- M: Change displays between “kb/s”, “kb”, “b”, and “mb”.
- R: Sort by traffic received.
- S: Sort by traffic sent.
- Q: quit
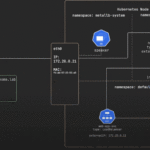
iptraf-ng is another way to monitor network traffic. It provides a number of different interactive monitoring interfaces.
Note: IPTraf requires a screen size of at least 80 columns by 24 lines.
On Ubuntu, you can install iptraf-ng with the following command:
sudo apt install iptraf-ng
Copy
iptraf-ng needs to be run with root privileges, so you should precede it with sudo:
sudo iptraf-ng
Copy
You’ll be presented with a menu that uses a popular command line interface framework called ncurses.
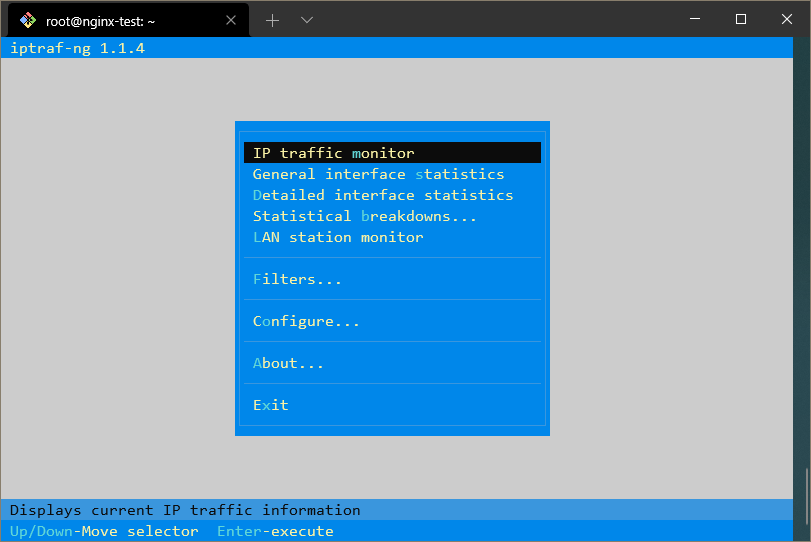
With this menu, you can select which interface you would like to access.
For example, to get an overview of all network traffic, you can select the first menu and then “All interfaces”. It will give you a screen that looks like this:
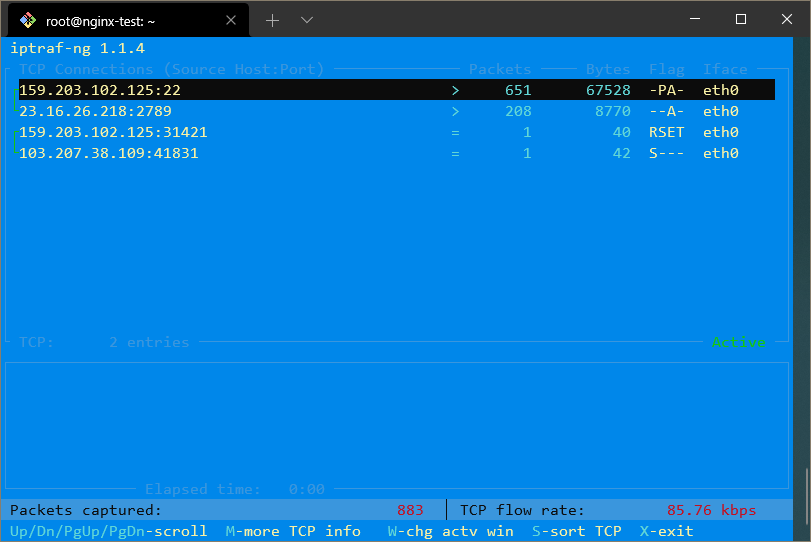
Here, you can see what IP addresses you are communicating on all of your network interfaces.
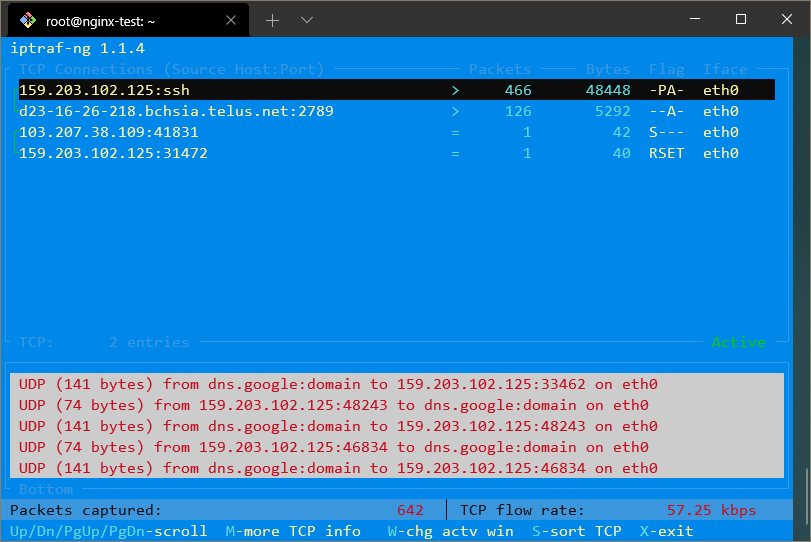
If you would like to have those IP addresses resolved into domains, you can enable reverse DNS lookup by exiting the traffic screen, selecting Configure and then toggling on Reverse DNS lookups.
You can also enable TCP/UDP service names to see the names of the services being run instead of the port numbers.
With both of these options enabled, the display may look like this:
The netstat command is another versatile tool for gathering network information.
netstat is installed by default on most modern systems, but you can install it yourself by downloading it from your server’s default package repositories. On most Linux systems, including Ubuntu, the package containing netstat is net-tools:
sudo apt install net-tools
Copy
By default, the netstat command on its own prints a list of open sockets:
netstat
Copy
OutputActive Internet connections (w/o servers)
Proto Recv-Q Send-Q Local Address           Foreign Address         State
tcp        0      0 192.241.187.204:ssh     ip223.hichina.com:50324 ESTABLISHED
tcp        0      0 192.241.187.204:ssh     rrcs-72-43-115-18:50615 ESTABLISHED
Active UNIX domain sockets (w/o servers)
Proto RefCnt Flags       Type       State         I-Node   Path
unix  5      [ ]         DGRAM                    6559     /dev/log
unix  3      [ ]         STREAM     CONNECTED     9386
unix  3      [ ]         STREAM     CONNECTED     9385
. . .
If you add an -a option, it will list all ports, listening and non-listening:
netstat -a
Copy
OutputActive Internet connections (servers and established)
Proto Recv-Q Send-Q Local Address           Foreign Address         State
tcp        0      0 *:ssh                   *:*                     LISTEN
tcp        0      0 192.241.187.204:ssh     rrcs-72-43-115-18:50615 ESTABLISHED
tcp6       0      0 [::]:ssh                [::]:*                  LISTEN
Active UNIX domain sockets (servers and established)
Proto RefCnt Flags       Type       State         I-Node   Path
unix  2      [ ACC ]     STREAM     LISTENING     6195     @/com/ubuntu/upstart
unix  2      [ ACC ]     STREAM     LISTENING     7762     /var/run/acpid.socket
unix  2      [ ACC ]     STREAM     LISTENING     6503     /var/run/dbus/system_bus_socket
. . .
If you’d like to filter to see only TCP or UDP connections, use the -t or -u flags respectively:
netstat -at
Copy
OutputActive Internet connections (servers and established)
Proto Recv-Q Send-Q Local Address           Foreign Address         State
tcp        0      0 *:ssh                   *:*                     LISTEN
tcp        0      0 192.241.187.204:ssh     rrcs-72-43-115-18:50615 ESTABLISHED
tcp6       0      0 [::]:ssh                [::]:*                  LISTEN
See statistics by passing the “-s” flag:
netstat -s
Copy
OutputIp:
    13500 total packets received
    0 forwarded
    0 incoming packets discarded
    13500 incoming packets delivered
    3078 requests sent out
    16 dropped because of missing route
Icmp:
    41 ICMP messages received
    0 input ICMP message failed.
    ICMP input histogram:
        echo requests: 1
        echo replies: 40
. . .
If you would like to continuously update the output, you can use the -c flag. There are many other options available to netstat which you learn by reviewing its manual page.
In the next step, you’ll learn some useful ways of monitoring your disk usage.
Step 3 – How To Monitor Your Disk Usage
For a quick overview of how much disk space is left on your attached drives, you can use the df program.
Without any options, its output looks like this:
df
Copy
OutputFilesystem     1K-blocks    Used Available Use% Mounted on
/dev/vda        31383196 1228936  28581396   5% /
udev              505152       4    505148   1% /dev
tmpfs             203920     204    203716   1% /run
none                5120       0      5120   0% /run/lock
none              509800       0    509800   0% /run/shm
This outputs disk usage in bytes, which may be a bit hard to read.
To fix this problem, you can specify output in a human-readable format:
df -h
Copy
OutputFilesystem      Size  Used Avail Use% Mounted on
/dev/vda         30G  1.2G   28G   5% /
udev            494M  4.0K  494M   1% /dev
tmpfs           200M  204K  199M   1% /run
none            5.0M     0  5.0M   0% /run/lock
none            498M     0  498M   0% /run/shm
If you want to see the total disk space available on all filesystems, you can pass the --total option. This will add a row at the bottom with summary information:
df -h --total
Copy
OutputFilesystem      Size  Used Avail Use% Mounted on
/dev/vda         30G  1.2G   28G   5% /
udev            494M  4.0K  494M   1% /dev
tmpfs           200M  204K  199M   1% /run
none            5.0M     0  5.0M   0% /run/lock
none            498M     0  498M   0% /run/shm
total            32G  1.2G   29G   4%
df can provide a useful overview. Another command, du gives a breakdown by directory.
du will analyze usage for the current directory and any subdirectories. The default output of du running in a nearly-empty home directory looks like this:
du
Copy
Output4    ./.cache
8    ./.ssh
28    .
Once again, you can specify human-readable output by passing it -h:
du -h
Copy
Output4.0K    ./.cache
8.0K    ./.ssh
28K    .
To see file sizes as well as directories, type the following:
du -a
Copy
Output0    ./.cache/motd.legal-displayed
4    ./.cache
4    ./.ssh/authorized_keys
8    ./.ssh
4    ./.profile
4    ./.bashrc
4    ./.bash_history
28    .
For a total at the bottom, you can add the -c option:
du -c
Copy
Output4    ./.cache
8    ./.ssh
28    .
28    total
If you are only interested in the total and not the specifics, you can issue:
du -s
Copy
Output28 .
There is also an ncurses interface for du, appropriately called ncdu, that you can install:
sudo apt install ncdu
Copy
This will graphically represent your disk usage:
ncdu
Copy
Output--- /root ----------------------------------------------------------------------
    8.0KiB [##########] /.ssh
    4.0KiB [#####     ] /.cache
    4.0KiB [#####     ]  .bashrc
    4.0KiB [#####     ]  .profile
    4.0KiB [#####     ]  .bash_history
You can step through the filesystem by using the up and down arrows and pressing Enter on any directory entry.
In the last section, you’ll learn how to monitor your memory usage.
Step 4 – How To Monitor Your Memory Usage
You can check the current memory usage on your system by using the free command.
When used without options, the output looks like this:
free
Copy
Output              total        used        free      shared  buff/cache   available
Mem:        1004896      390988      123484        3124      490424      313744
Swap:             0           0           0
To display in a more readable format, you can pass the -m option to display the output in megabytes:
free -m
Copy
Output              total        used        free      shared  buff/cache   available
Mem:            981         382         120           3         478         306
Swap:             0           0           0
The Mem line includes the memory used for buffering and caching, which is freed up as soon as needed for other purposes. Swap is memory that has been written to a swapfile on disk in order to conserve active memory.
Finally, the vmstat command can output various information about your system, including memory, swap, disk io, and cpu information.
You can use the command to get another view into memory usage:
vmstat
Copy
Outputprocs -----------memory---------- ---swap-- -----io---- -system-- ----cpu----
 r  b   swpd   free   buff  cache   si   so    bi    bo   in   cs us sy id wa
 1  0      0  99340 123712 248296    0    0     0     1    9    3  0  0 100  0
You can see this in megabytes by specifying units with the -S flag:
vmstat -S M
Copy
Outputprocs -----------memory---------- ---swap-- -----io---- -system-- ----cpu----
 r  b   swpd   free   buff  cache   si   so    bi    bo   in   cs us sy id wa
 1  0      0     96    120    242    0    0     0     1    9    3  0  0 100  0
To get some general statistics about memory usage, type:
vmstat -s -S M
Copy
Output          495 M total memory
          398 M used memory
          252 M active memory
          119 M inactive memory
           96 M free memory
          120 M buffer memory
          242 M swap cache
            0 M total swap
            0 M used swap
            0 M free swap
. . .
To get information about individual system processes’ cache usage, type:
vmstat -m -S M
Copy
OutputCache                       Num  Total   Size  Pages
ext4_groupinfo_4k           195    195    104     39
UDPLITEv6                     0      0    768     10
UDPv6                        10     10    768     10
tw_sock_TCPv6                 0      0    256     16
TCPv6                        11     11   1408     11
kcopyd_job                    0      0   2344     13
dm_uevent                     0      0   2464     13
bsg_cmd                       0      0    288     14
. . .
This will give you details about what kind of information is stored in the cache.
Conclusion
Using these tools, you should begin to be able to monitor your server from the command line. There are many other monitoring utilities that are used for different purposes, but these are a good starting point.
Next, you may want to learn about Linux process management using ps, kill, and nice.